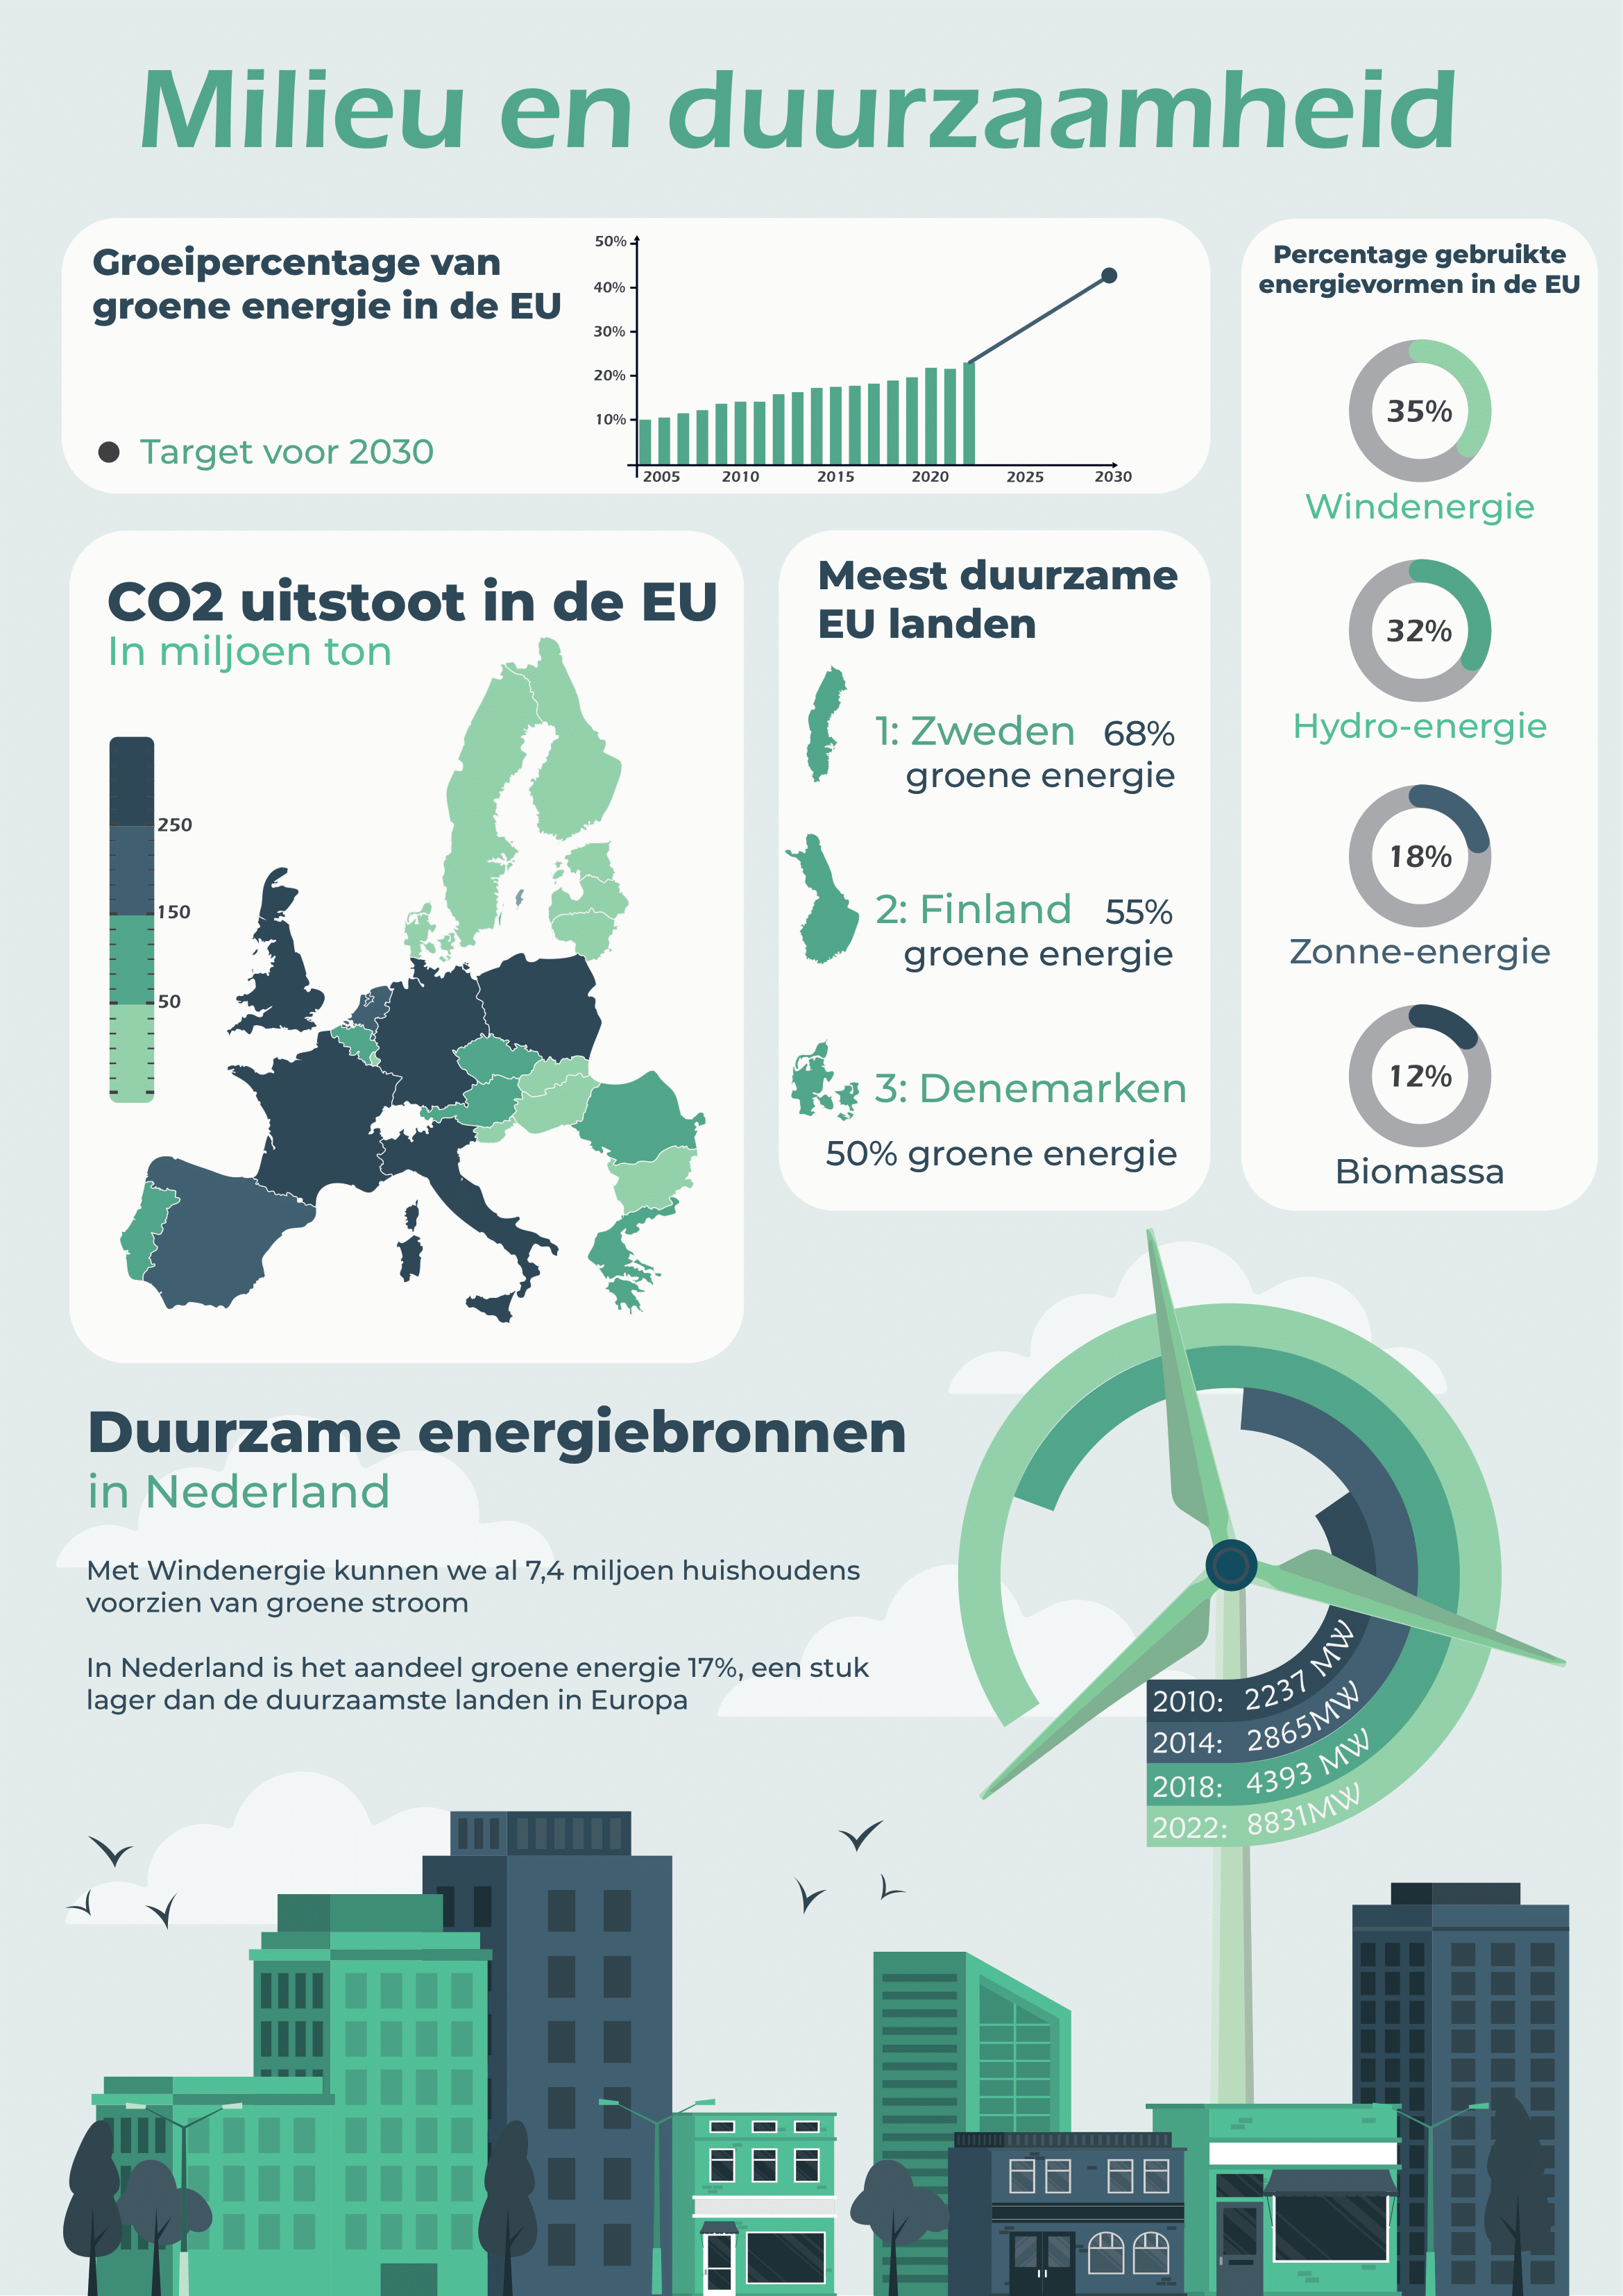
This infographic presents key insights on sustainability and green energy in the EU through a clean, well-structured design. Using maps, charts, and icons, it highlights CO2 emissions, renewable energy sources, and the most sustainable countries. With a calm visual style and balanced color palette, the infographic makes complex data easy to understand. The goal is to both inform and inspire more conscious and sustainable choices.